TimeBee's Quarterly Performance reports provide evaluations of your team members' productivity over a three-month period, using metrics derived from their tracked time on the desktop application.
Quarterly Performance reports establish long-term working trends for both individuals and your organization.
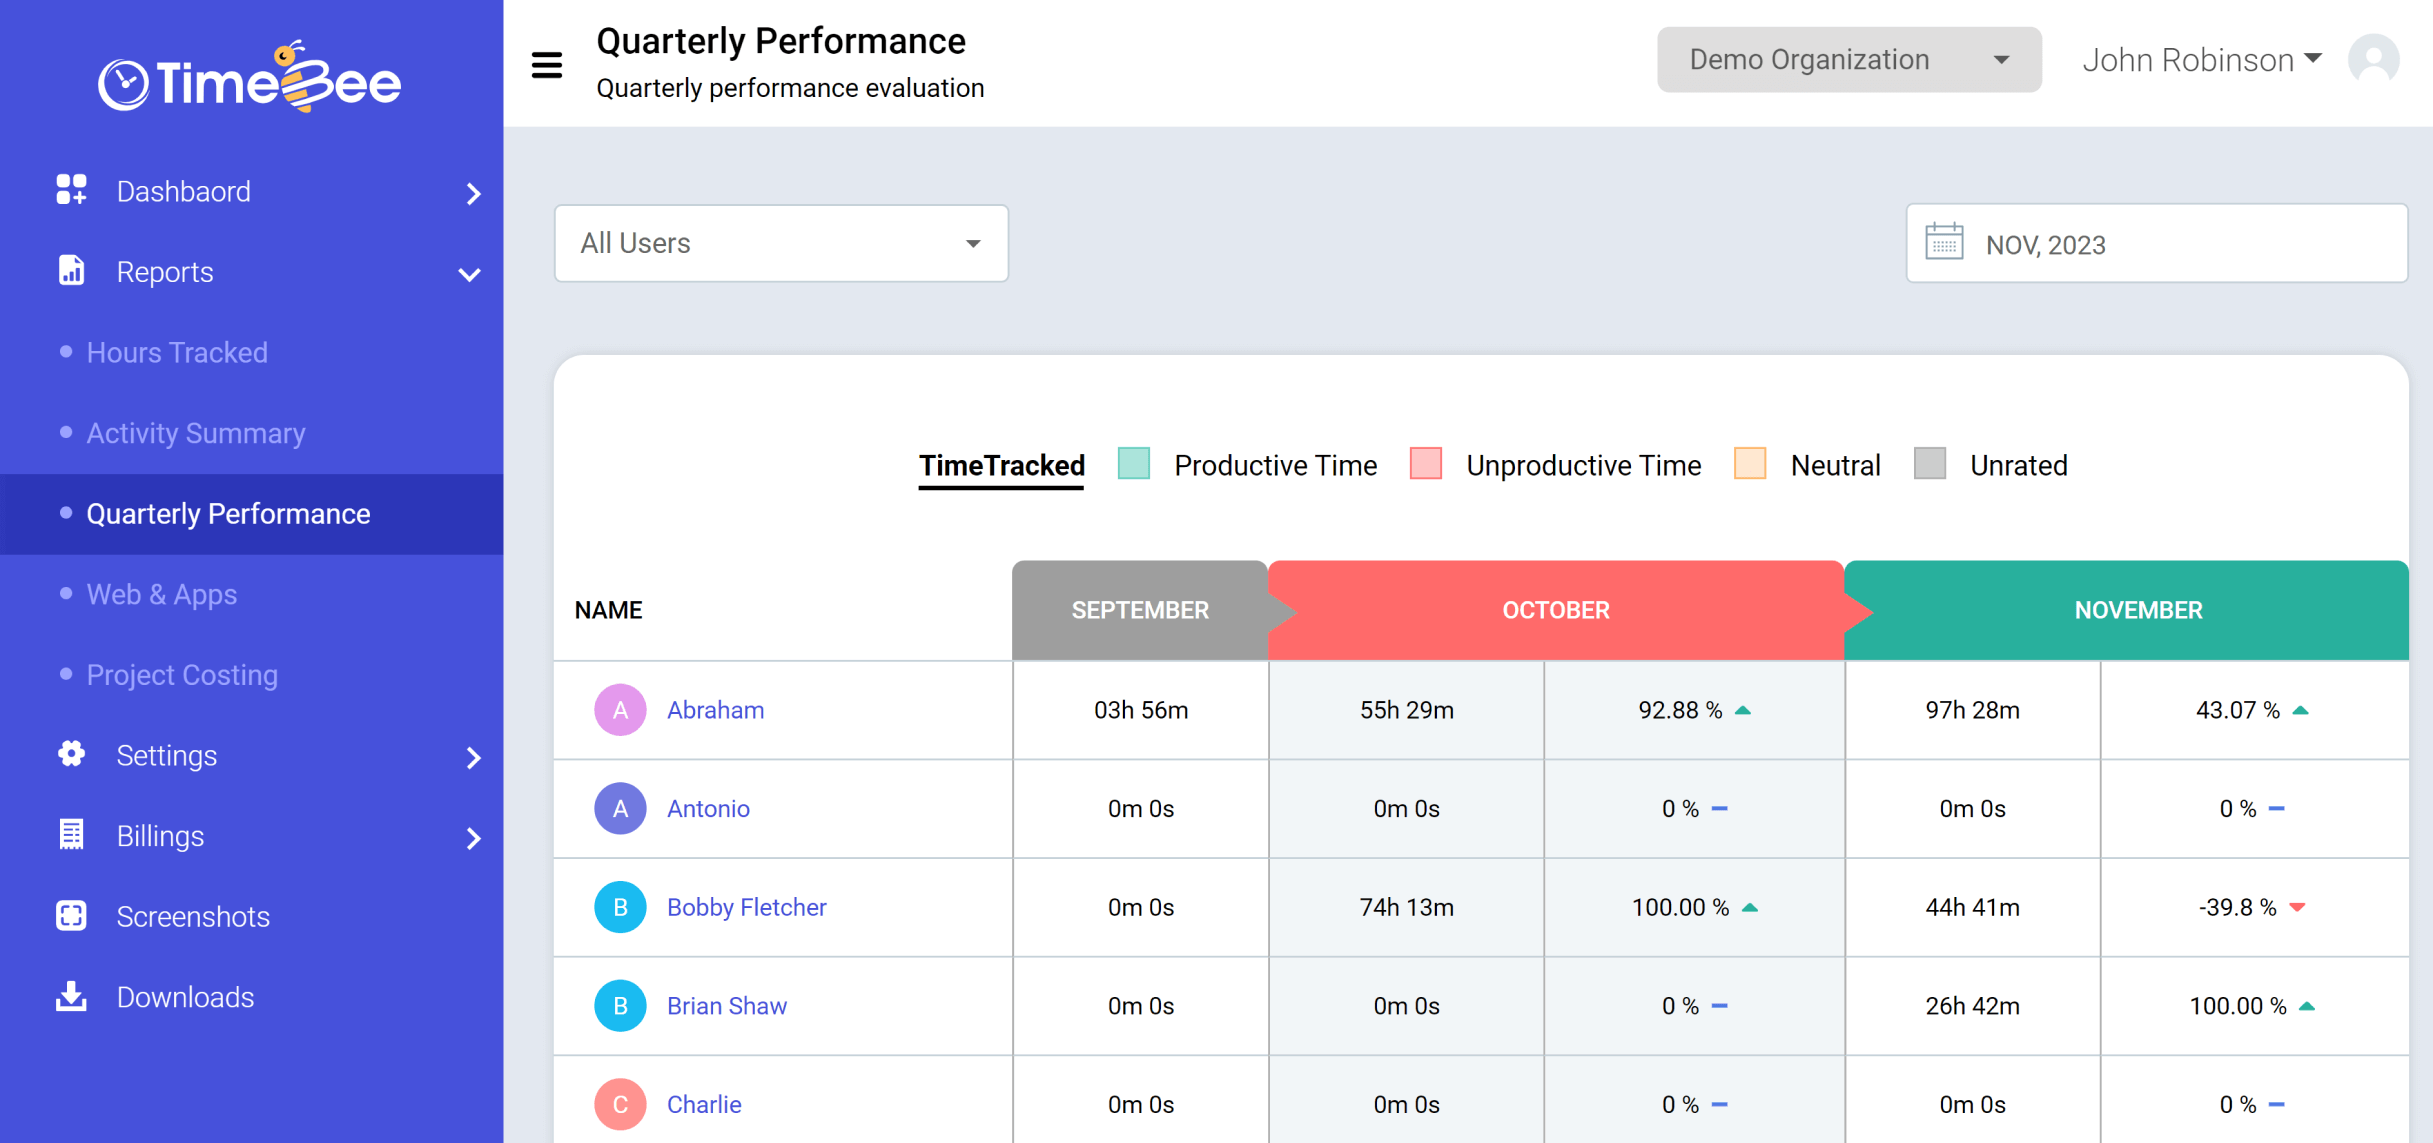
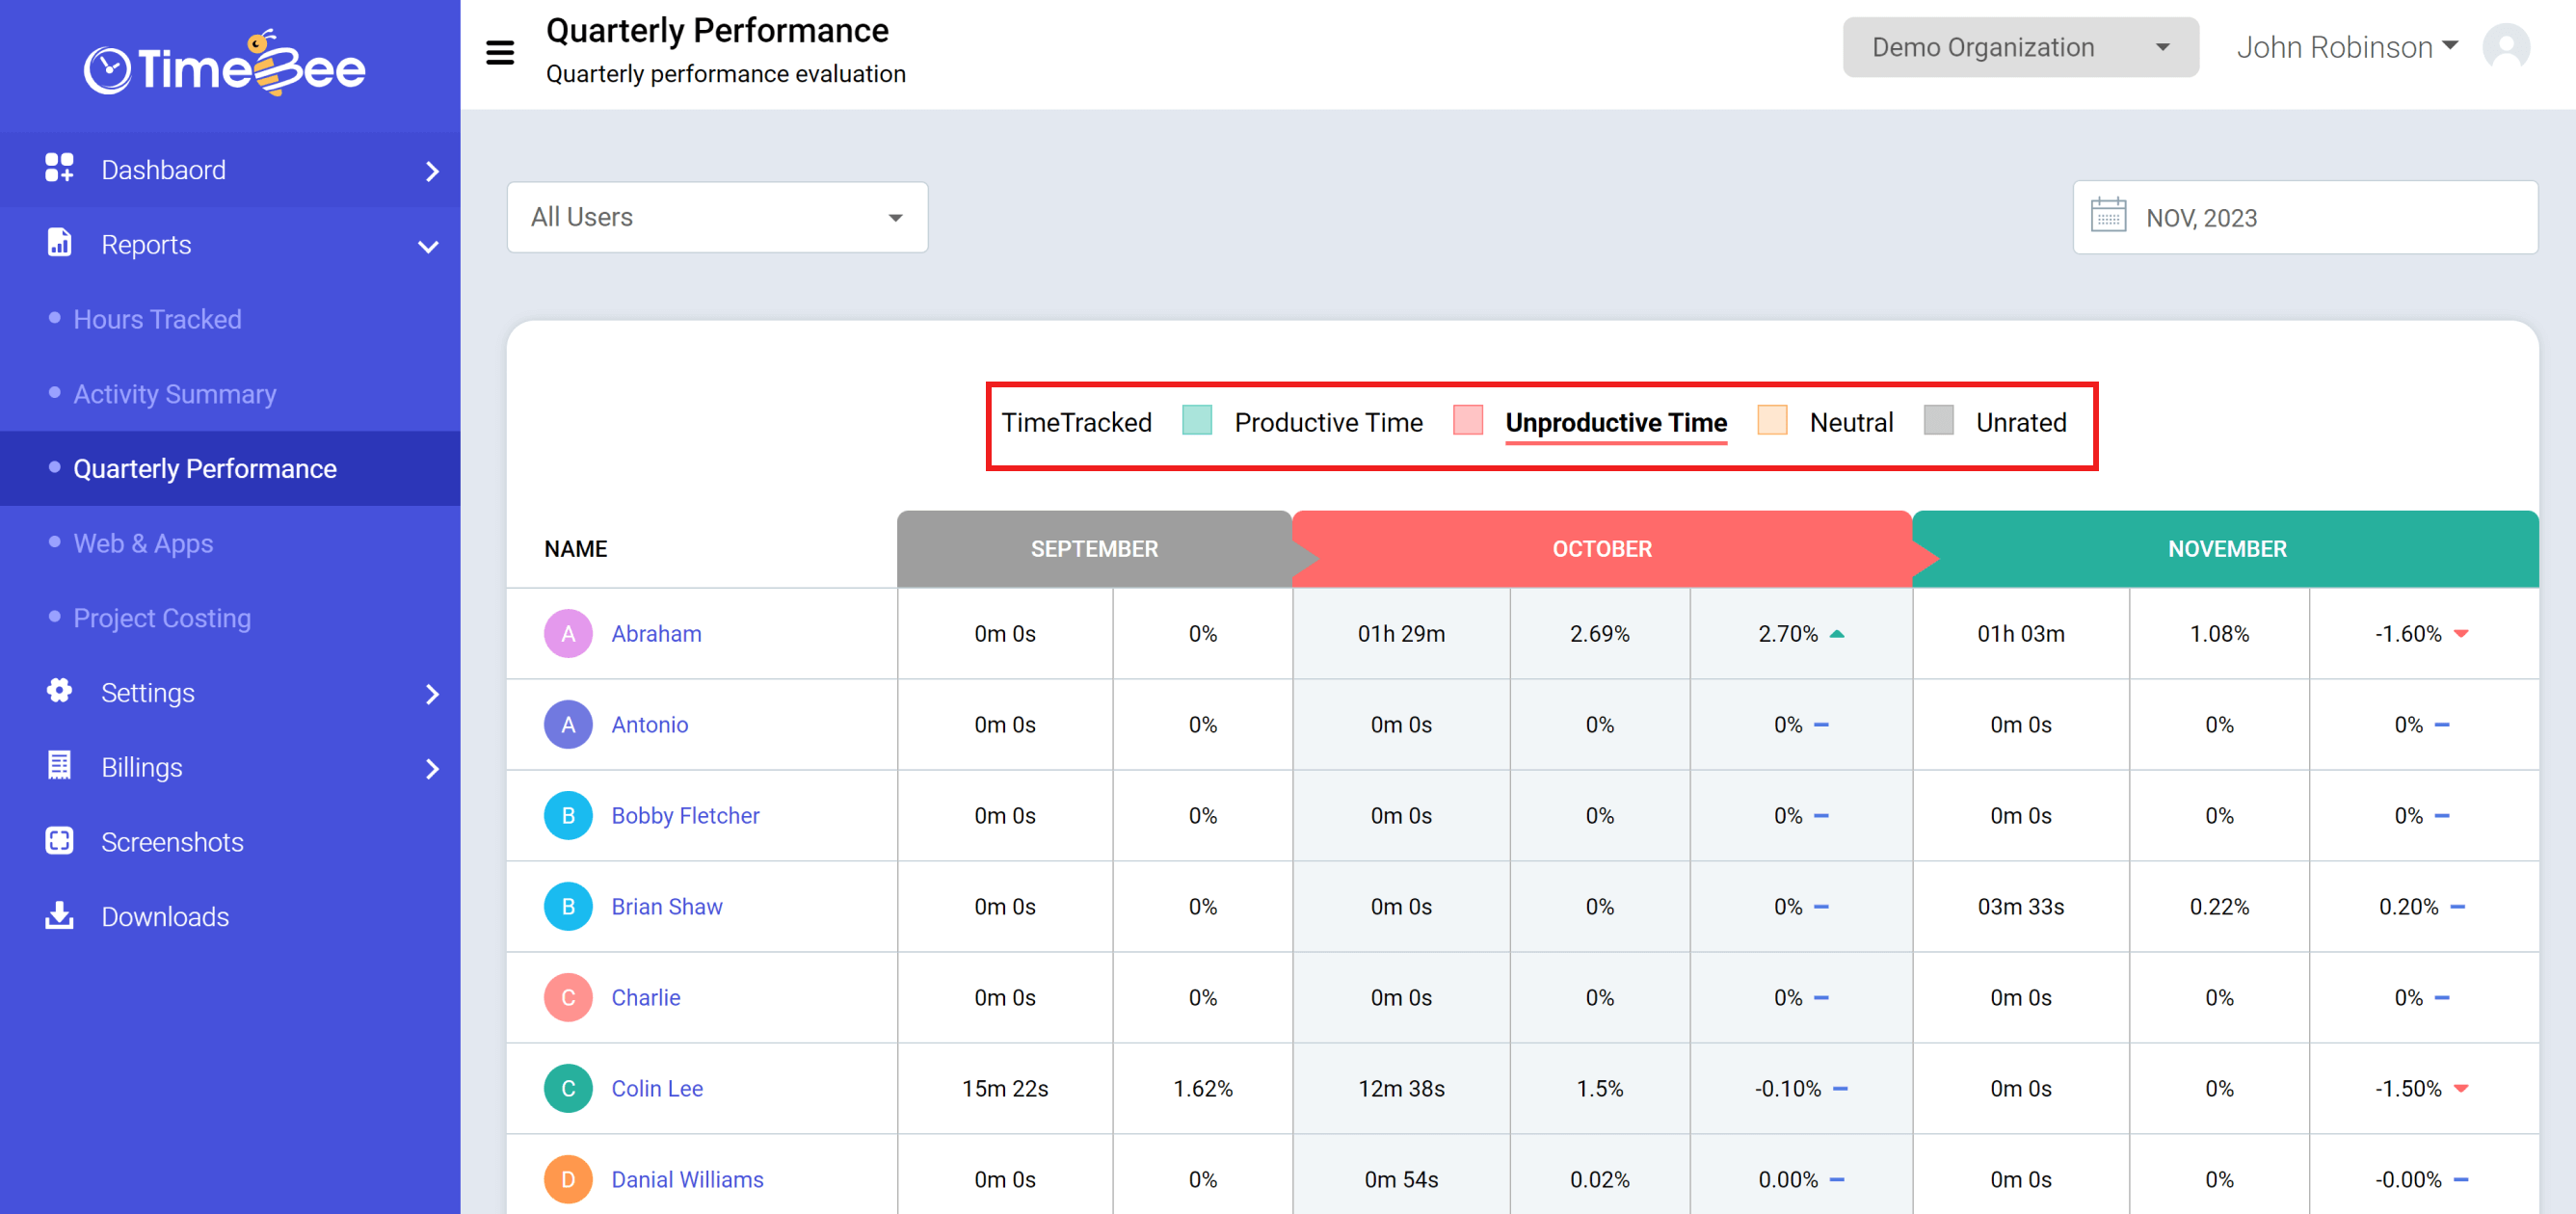
You can view trends classified under Time Tracked, Productive Time, Unproductive Time, Neutral, or Unrated. Selecting any of these values displays the respective report.
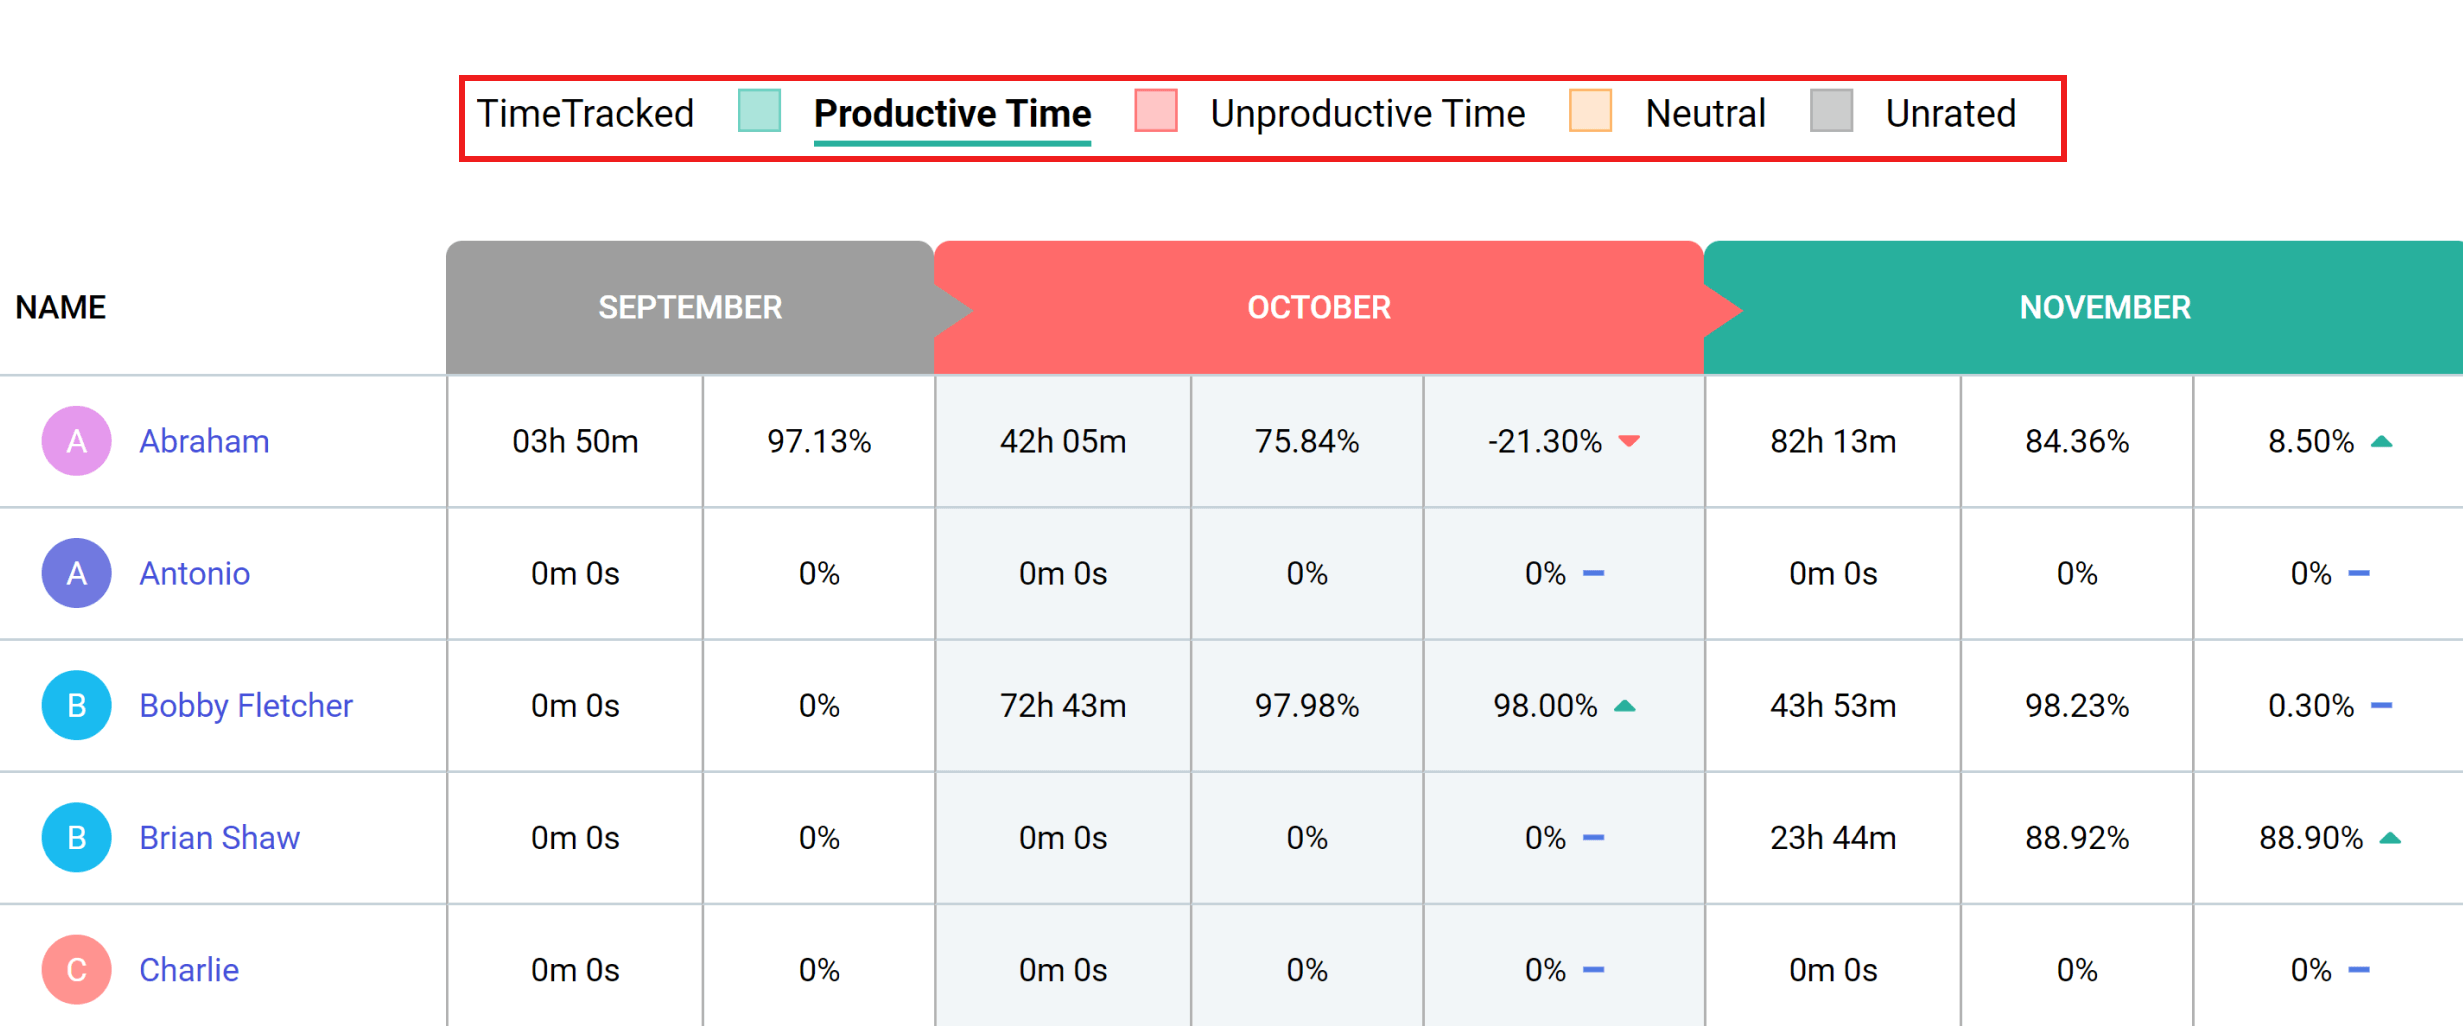
Changes in these metrics are visualized in a table, read left to right.
Under the first month column, you will see tracked time and the percentage value of the selected metric.
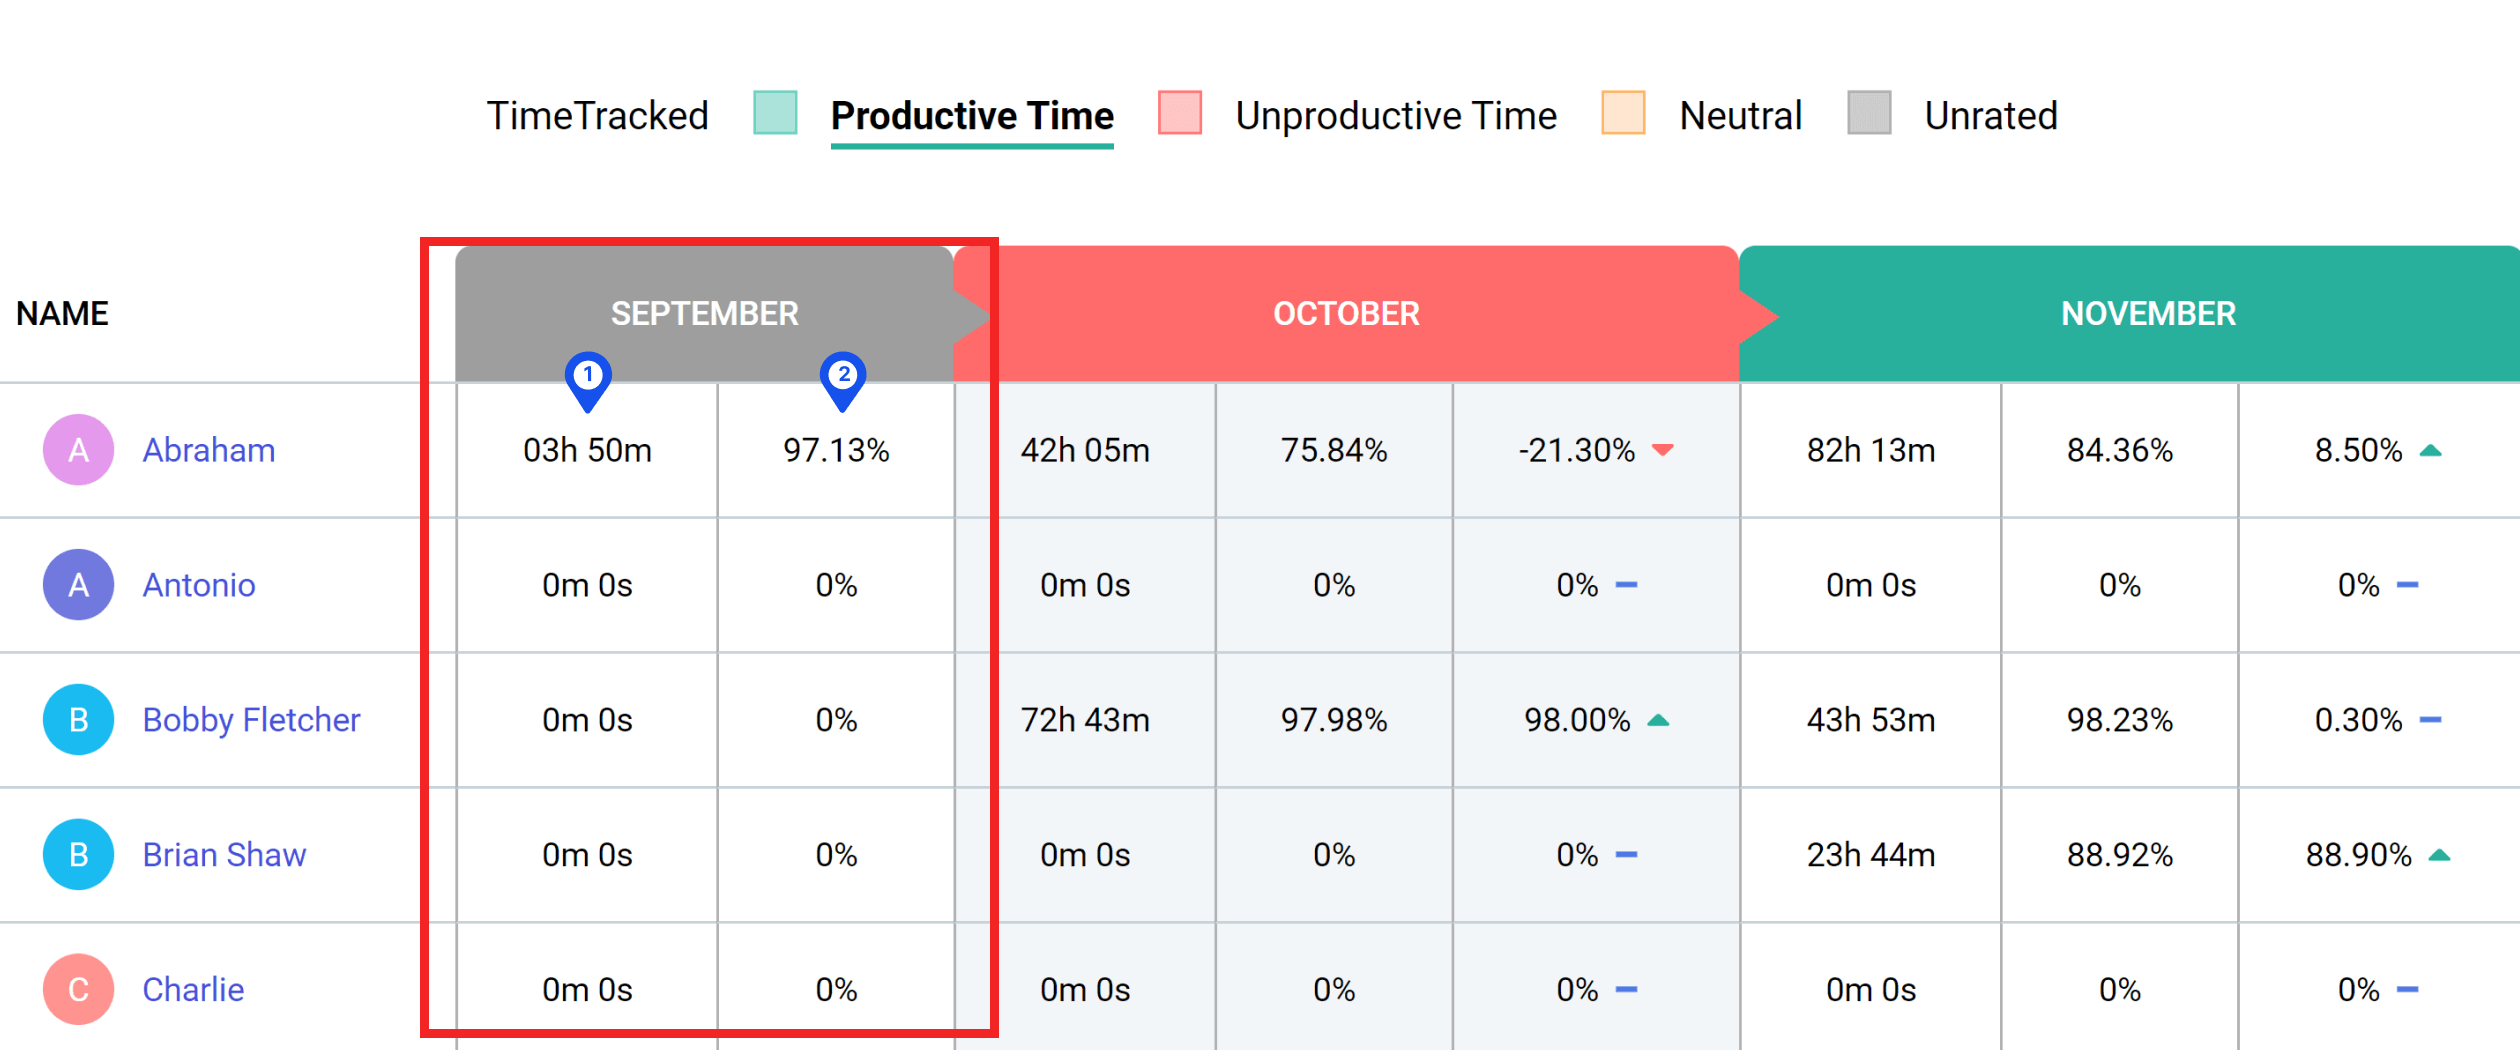
Please note that the tracked time metric will only show the time tracked in the first month column.
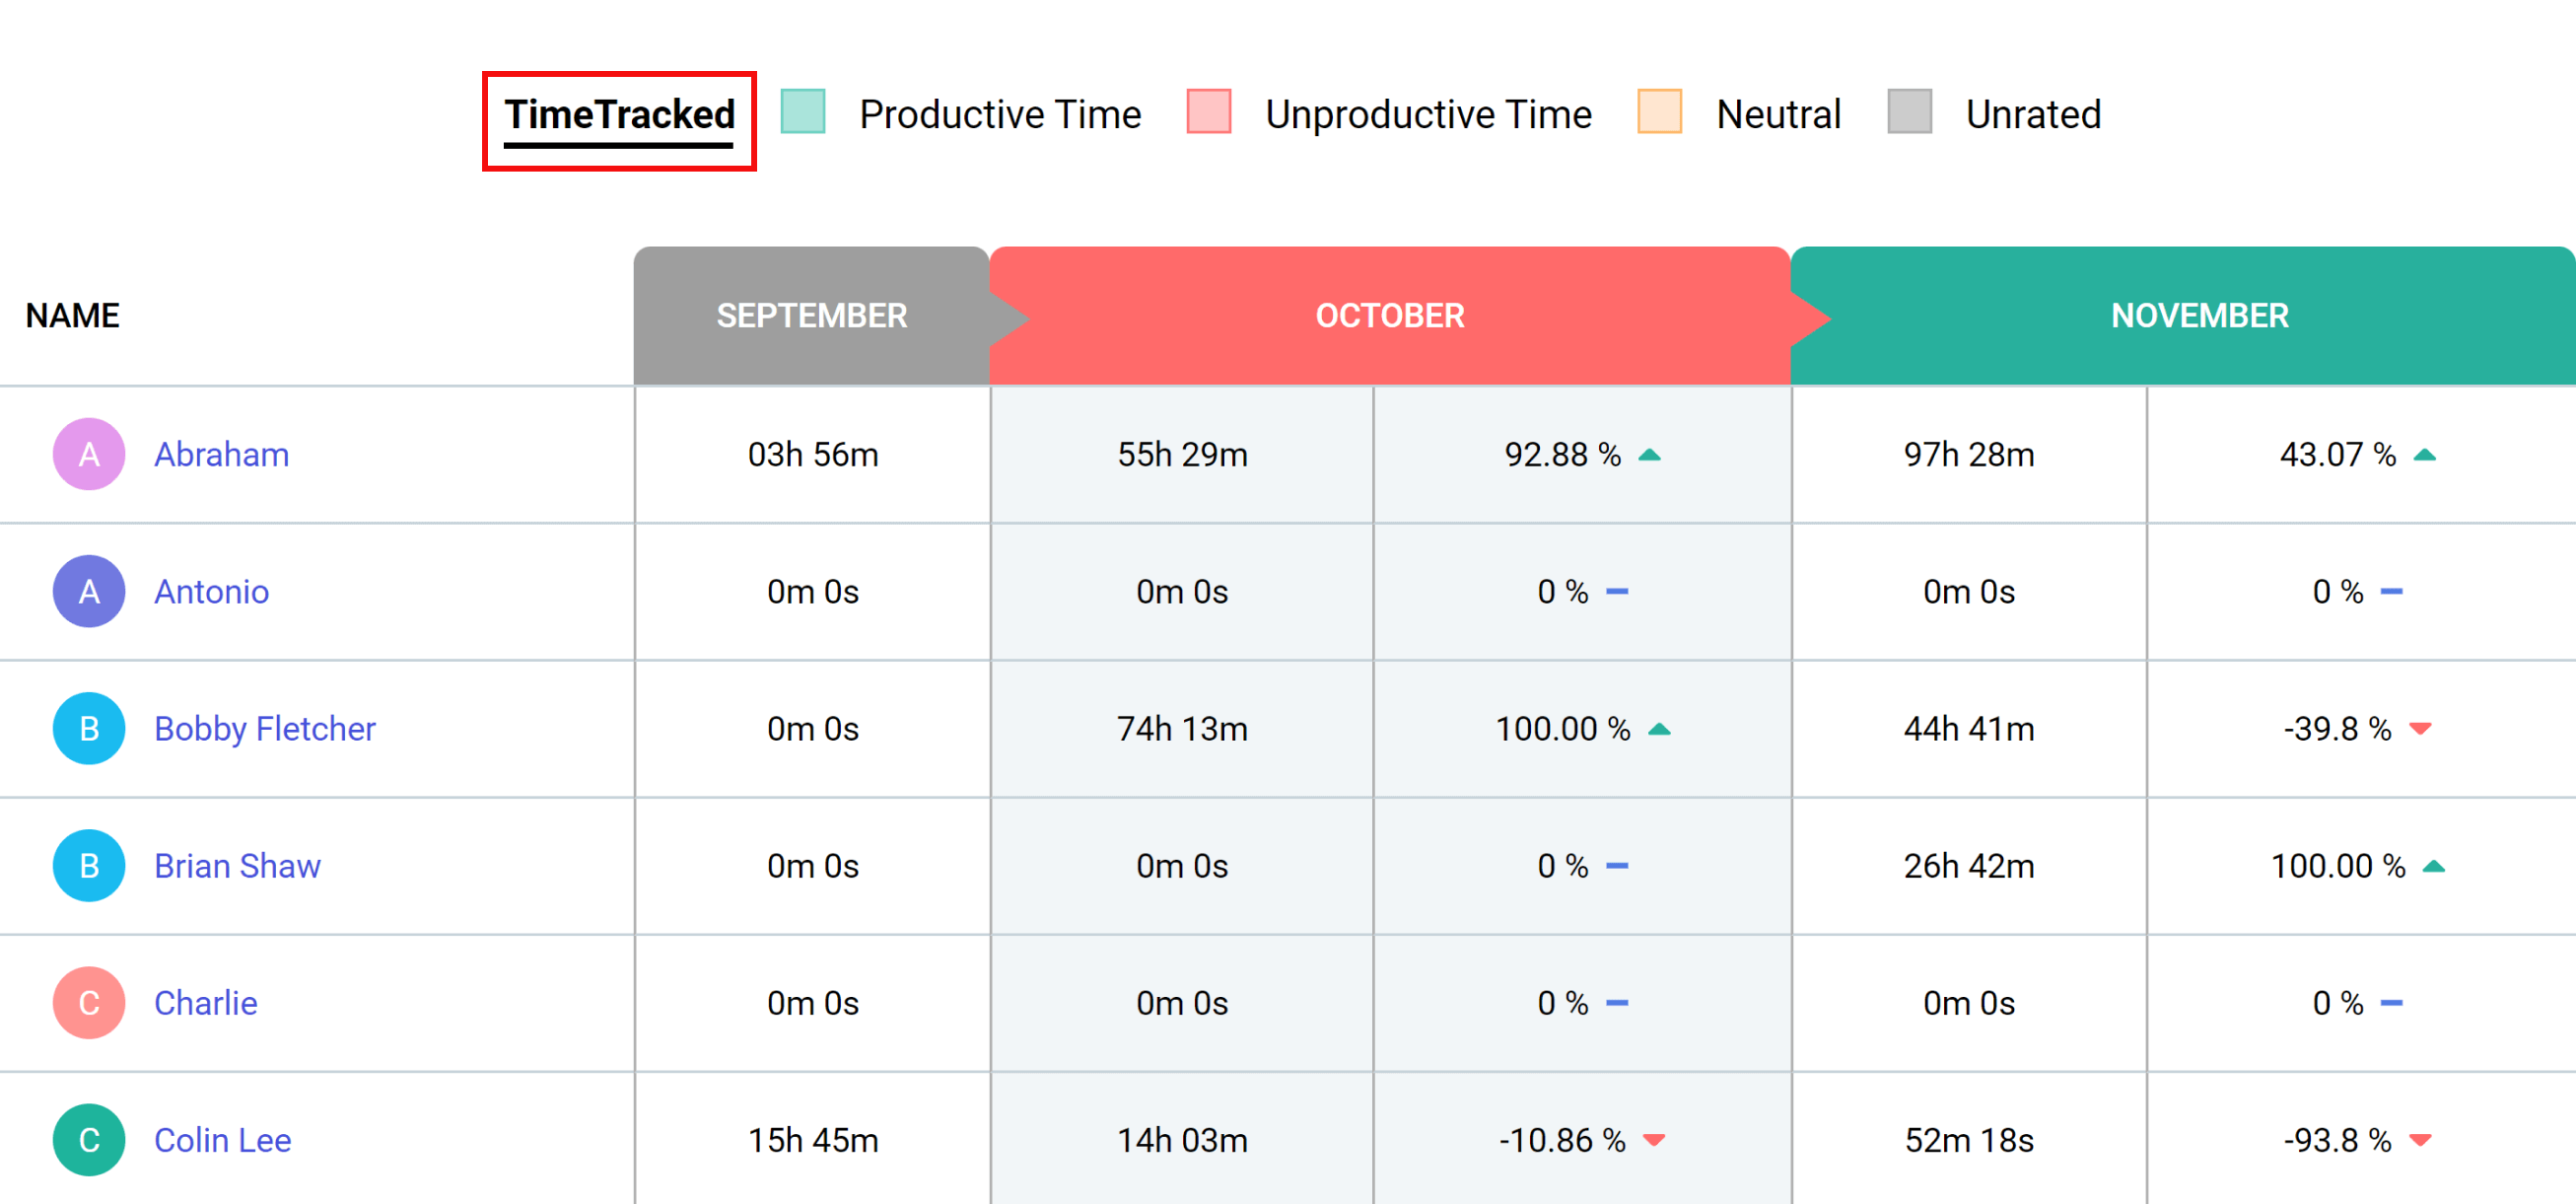
The second month column will show the tracked time for that particular month alongside the percentage value of the chosen metric. The third column will show the percentage difference between the first and second month.
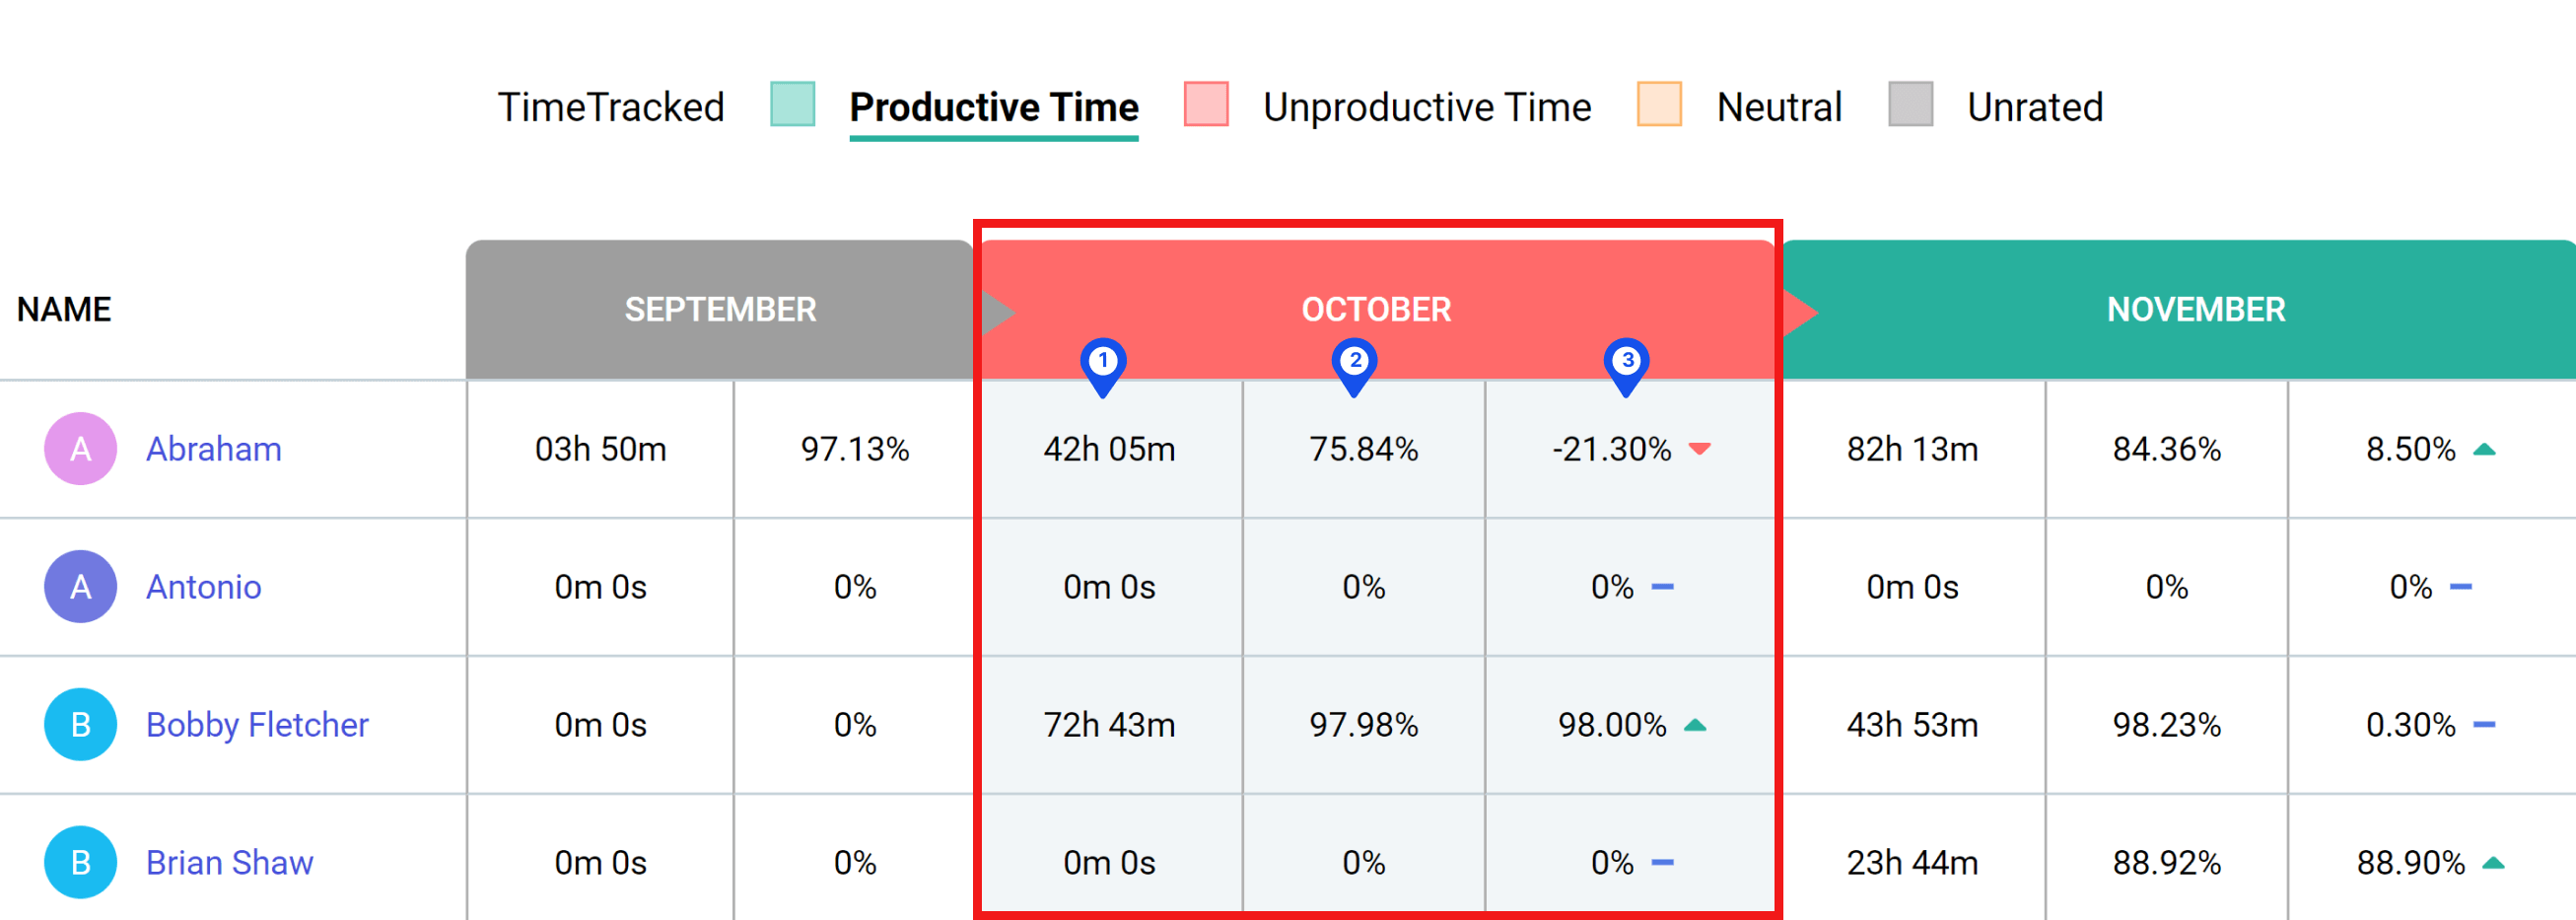
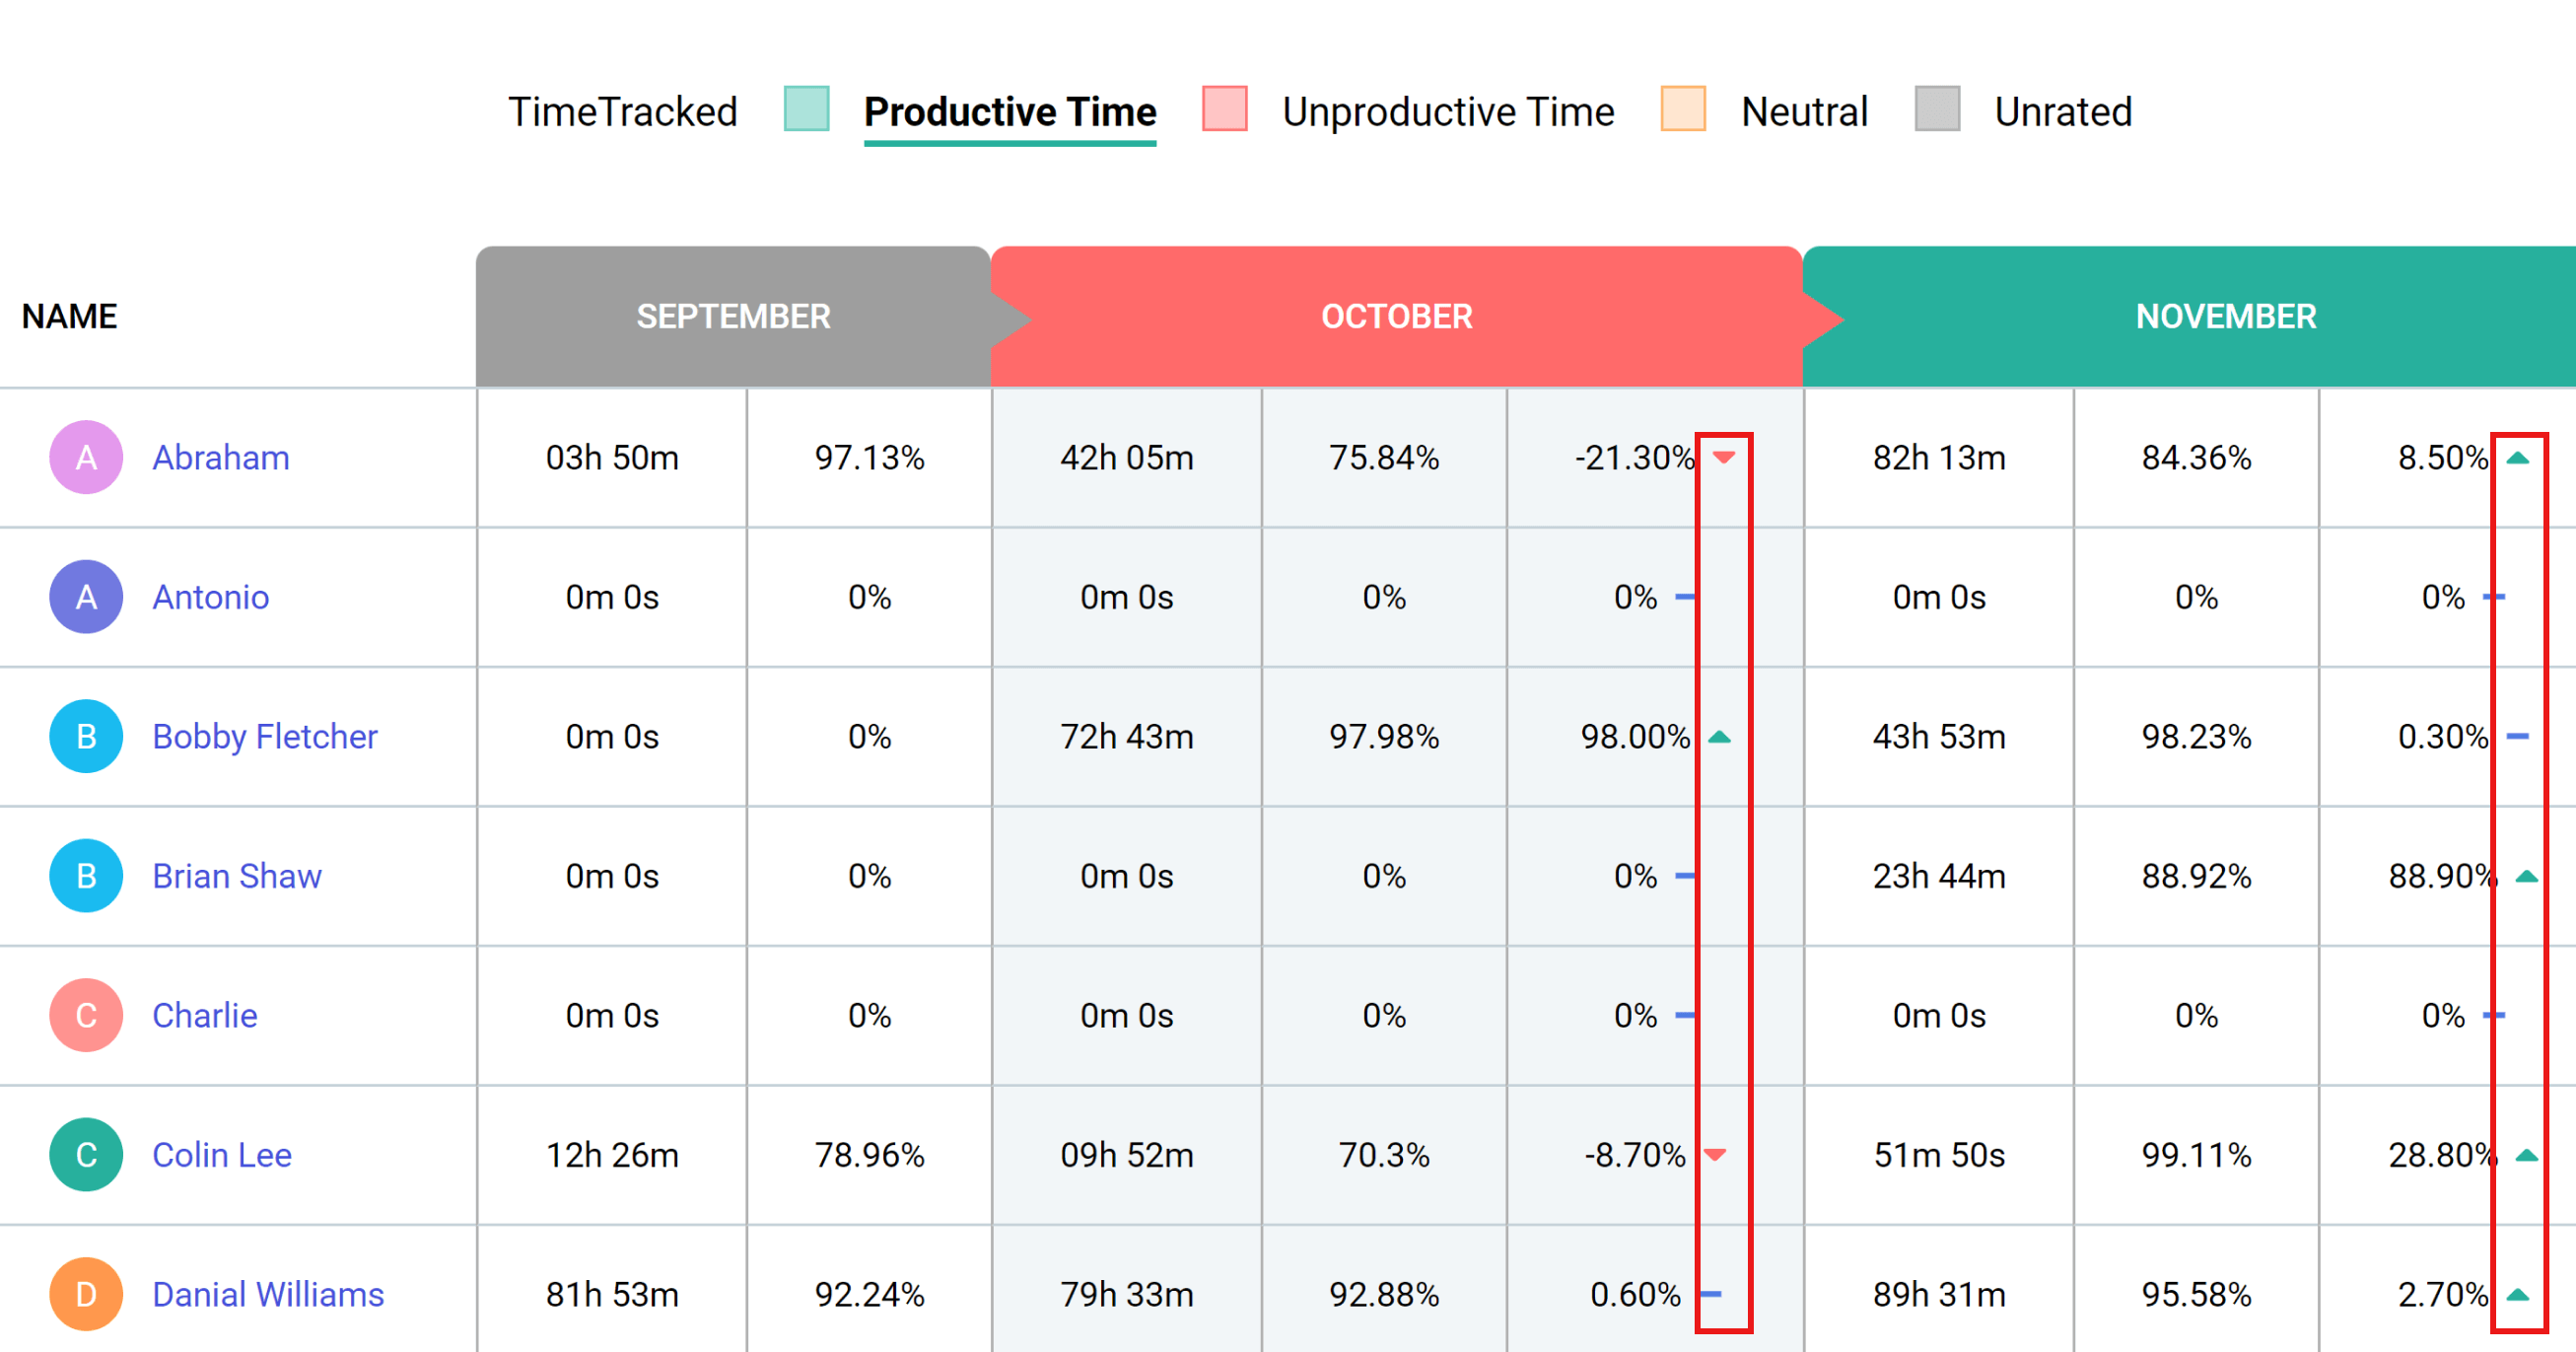
Quarterly Performance reports provide managers with insights into users’ performance to determine whether it has either improved, declined, or stayed consistent during the last three months. These are denoted through upward-facing arrow (Increased), downward-facing arrow (decreased), and dash (stagnant) symbols.
You can also view the categorization of productive, unproductive, neutral, and idle hours. This evaluation is based on Web & App usage.
Select “Reports” from the sidebar of the web app and then click “Quarterly Performance” in the drop-down menu.
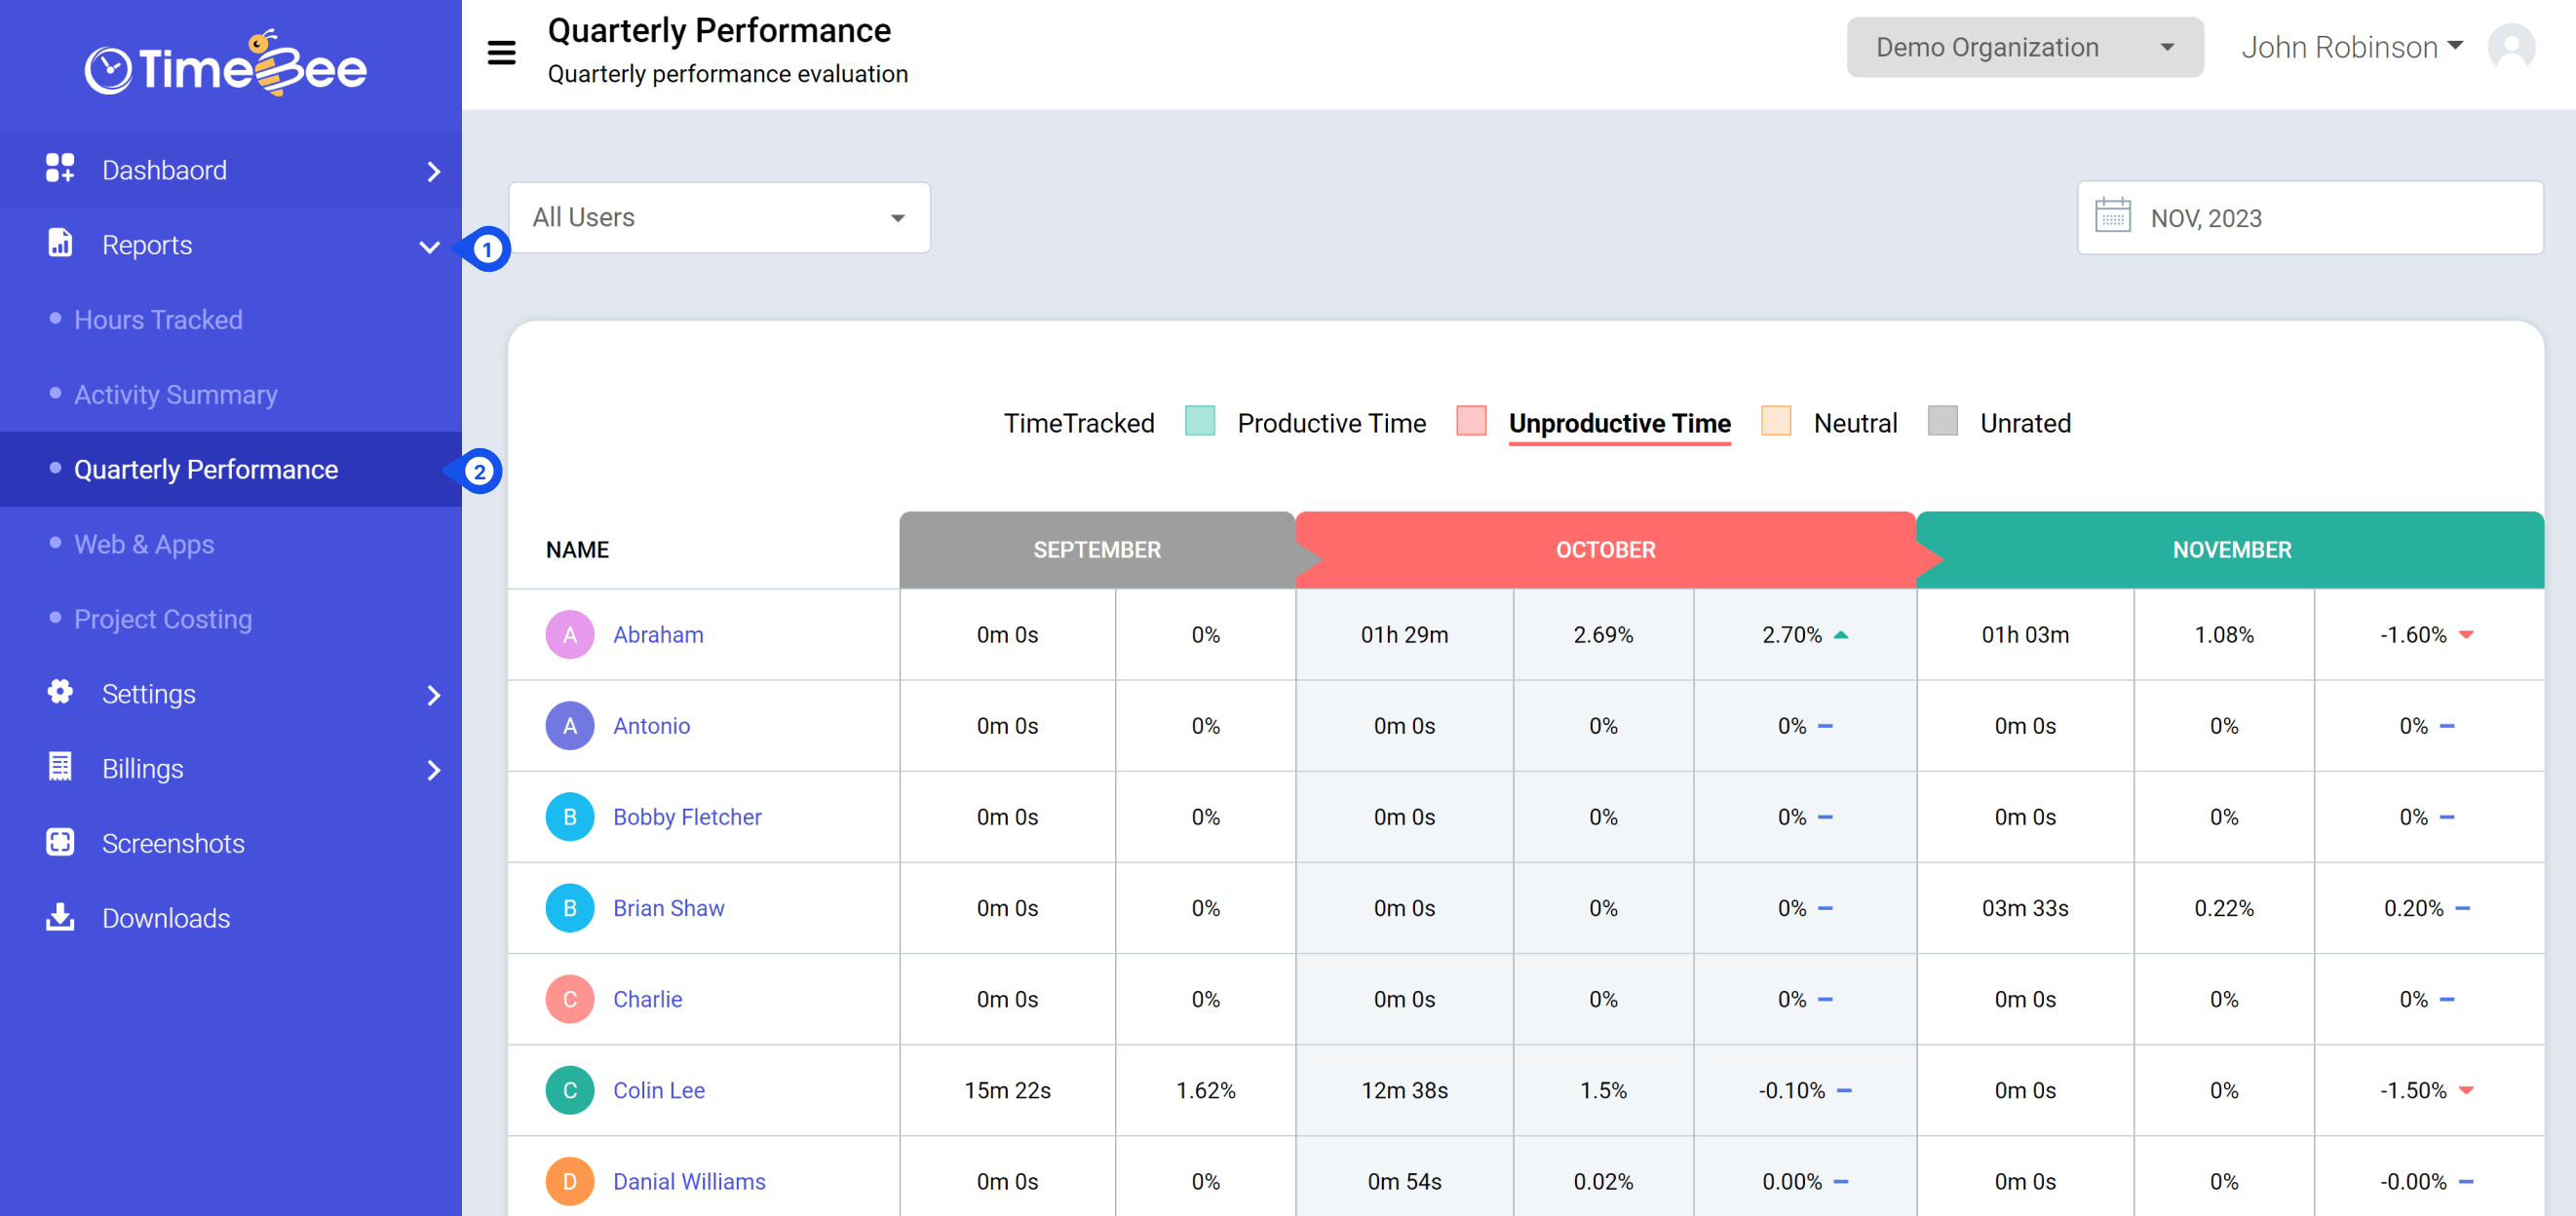
To view the categorized evaluation of users, click on your chosen category at the top of your Quarterly Performance page.
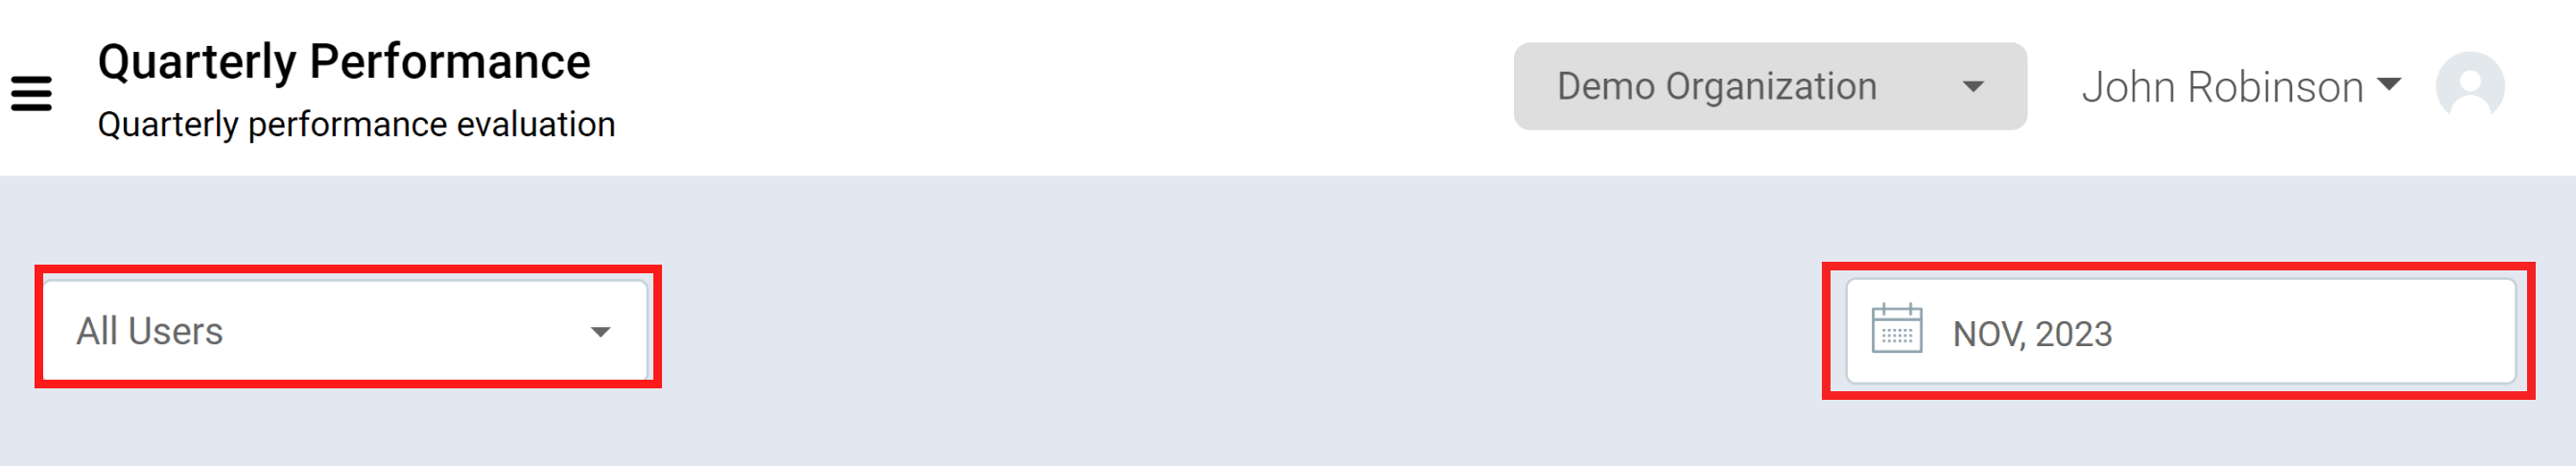
Use the filter to select a single user, multiple users, or groups. Utilize the date filter to view a report specific to a particular quarter.
To further customize the categorized evaluation report, you’ll need to change the settings of the web and apps from the Web & App Rating page.
Only the owners and admins can view and access quarterly performance reports for all the users and customize the settings.
Try it free for 14 days and see how it can be your savior!
