TimeBee’s User Dashboard provides data to monitor employee progress. Use this guide to understand the insights that the User Dashboard provides.
Summary of Work Hour Distribution widget is right at the top of the screen when you open “User Dashboard.” The widget shows you the daily, weekly, or monthly worked hours distributed in 5 categories.
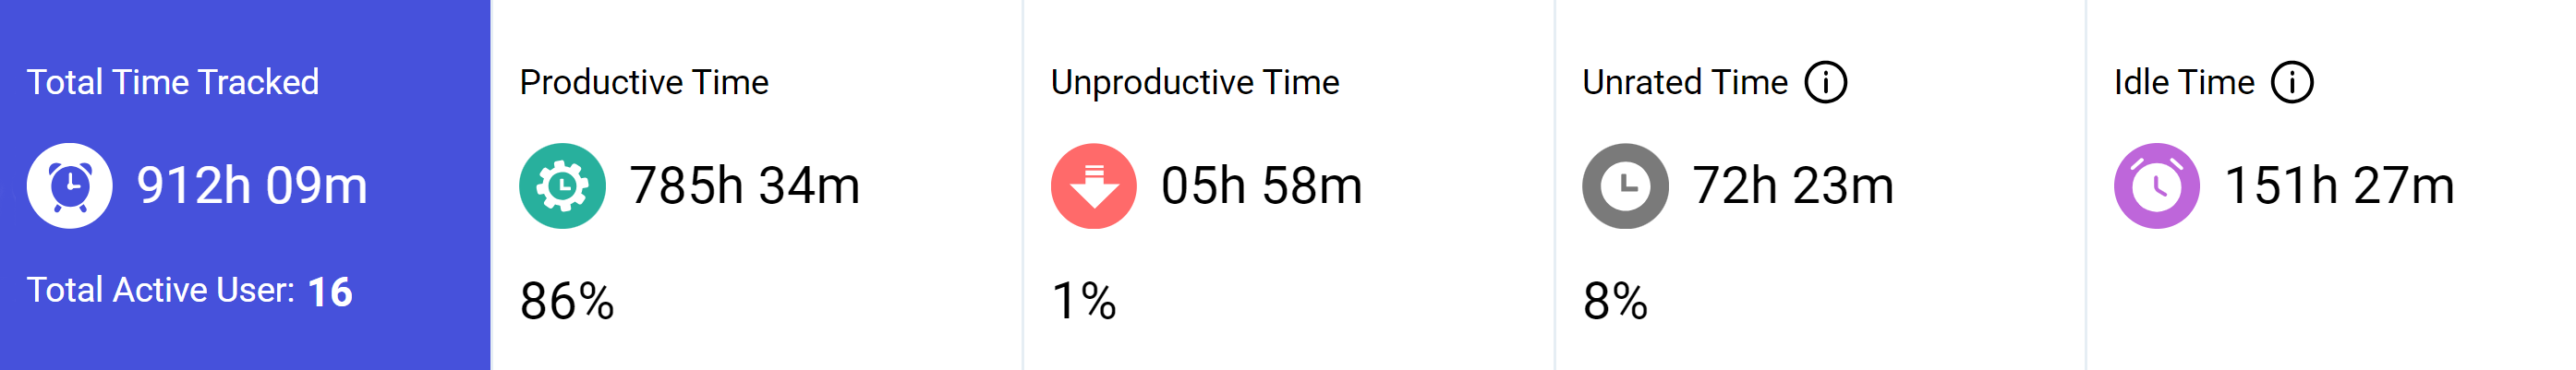
The distribution of hours helps you understand work patterns and cultivate productivity. Employees can see how they spend their time during the day and resolve unhealthy work cycles before they lead to burnout.
This widget provides insights into visual Timestamps and Activity levels. It also includes gaps for breaks. Hover your cursor on the blocks of the graph to view what you were working on.
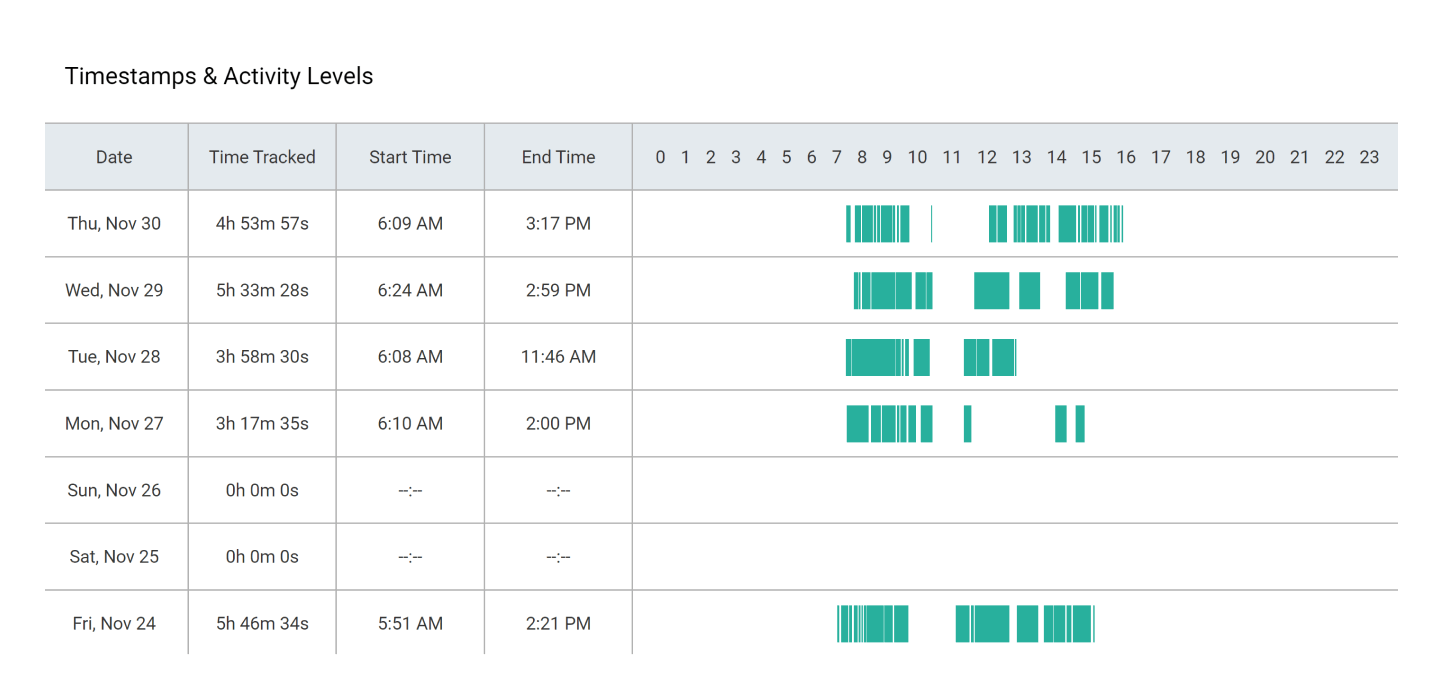
To get more insights from your day, click on the graph. It’ll open a window that will show you the breakdown of the day, including the projects and tasks you’ve worked on.
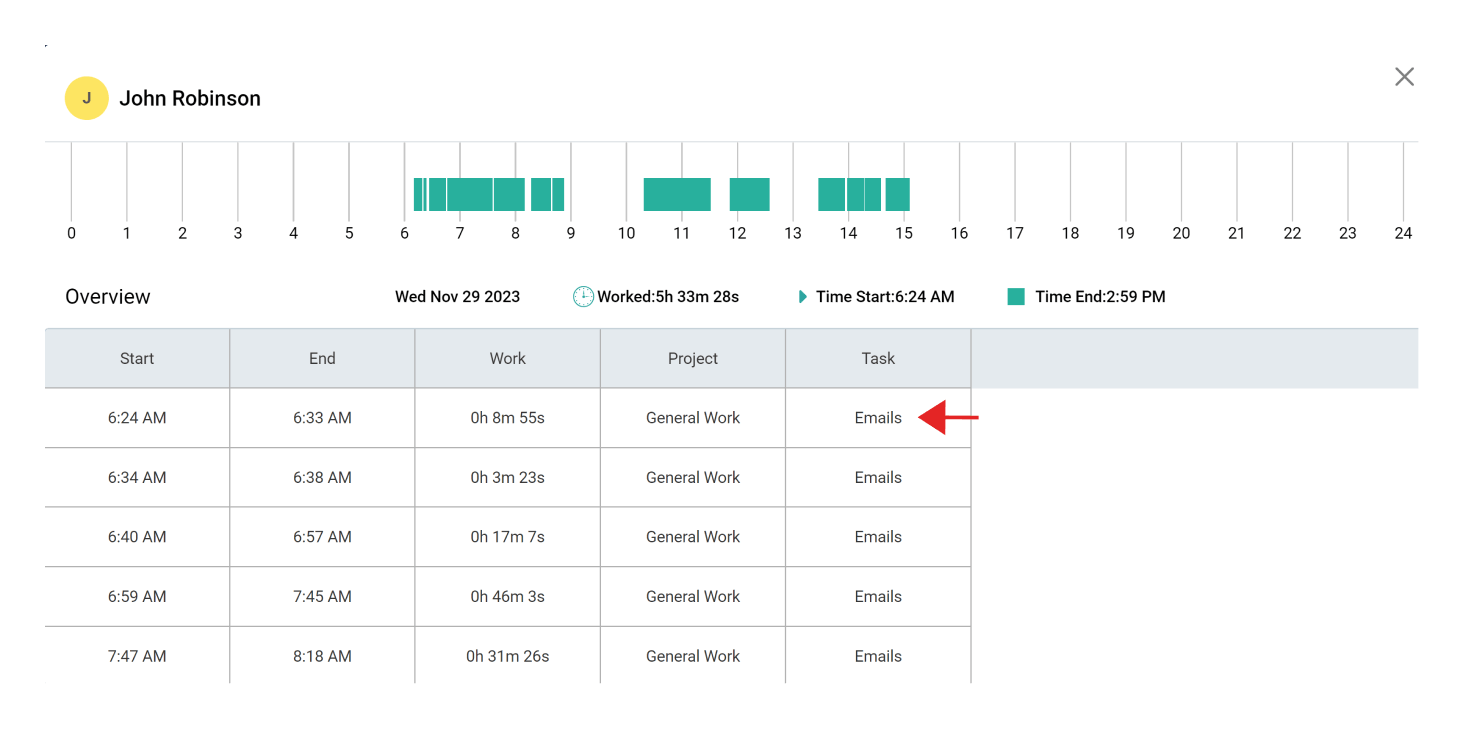
For further details, click on each bar for a more detailed insight report showing the Websites and Apps and the Screenshots captured for the user.
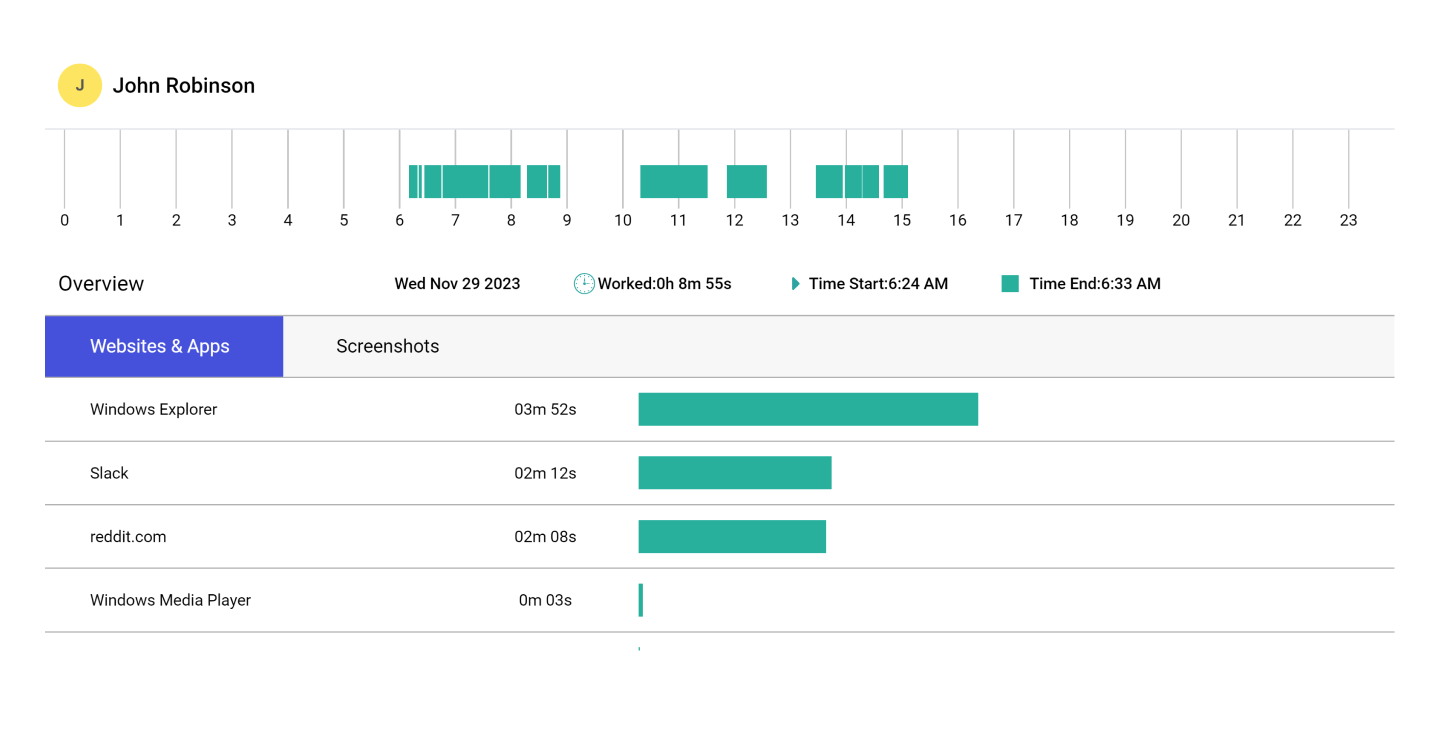
By viewing time blocks, time batches, and your activities, you can analyze how much time you need on a particular task and plan your day accordingly in the future.
This widget represents your time spent on Productive Hours (Left) and Unproductive Hours (Right) through a line graph.

Take your cursor on the dot to view the time spent in hours.
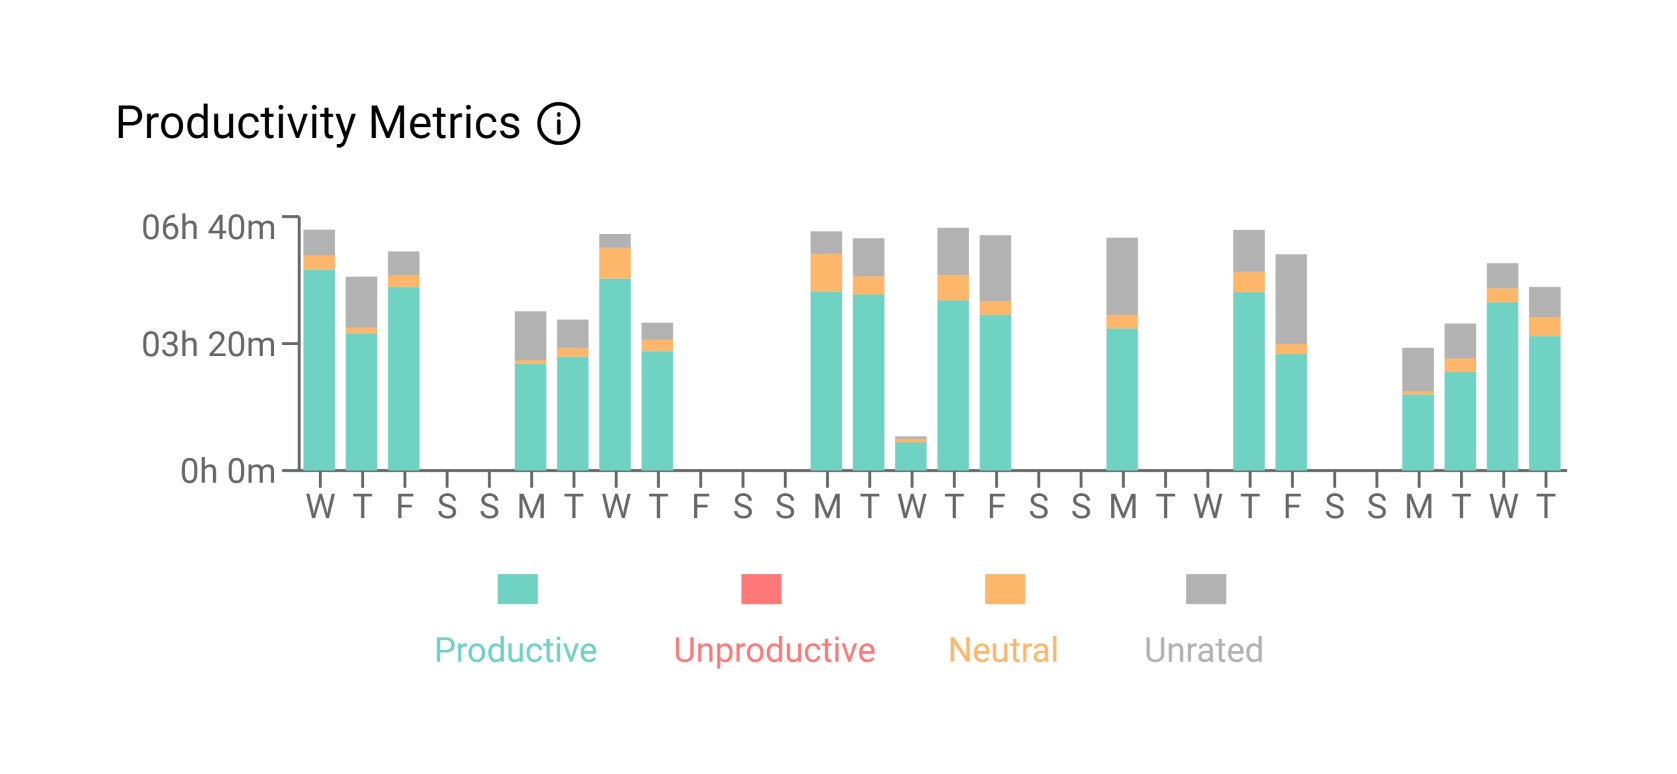
This widget visually represents the spent time of a user on Productive, Unproductive, Neutral, and Unrated activities in a bar graph.
Click each graph bar to get categorized time stamps for time spent on productive, unproductive, neutral, and unrated sites and apps.
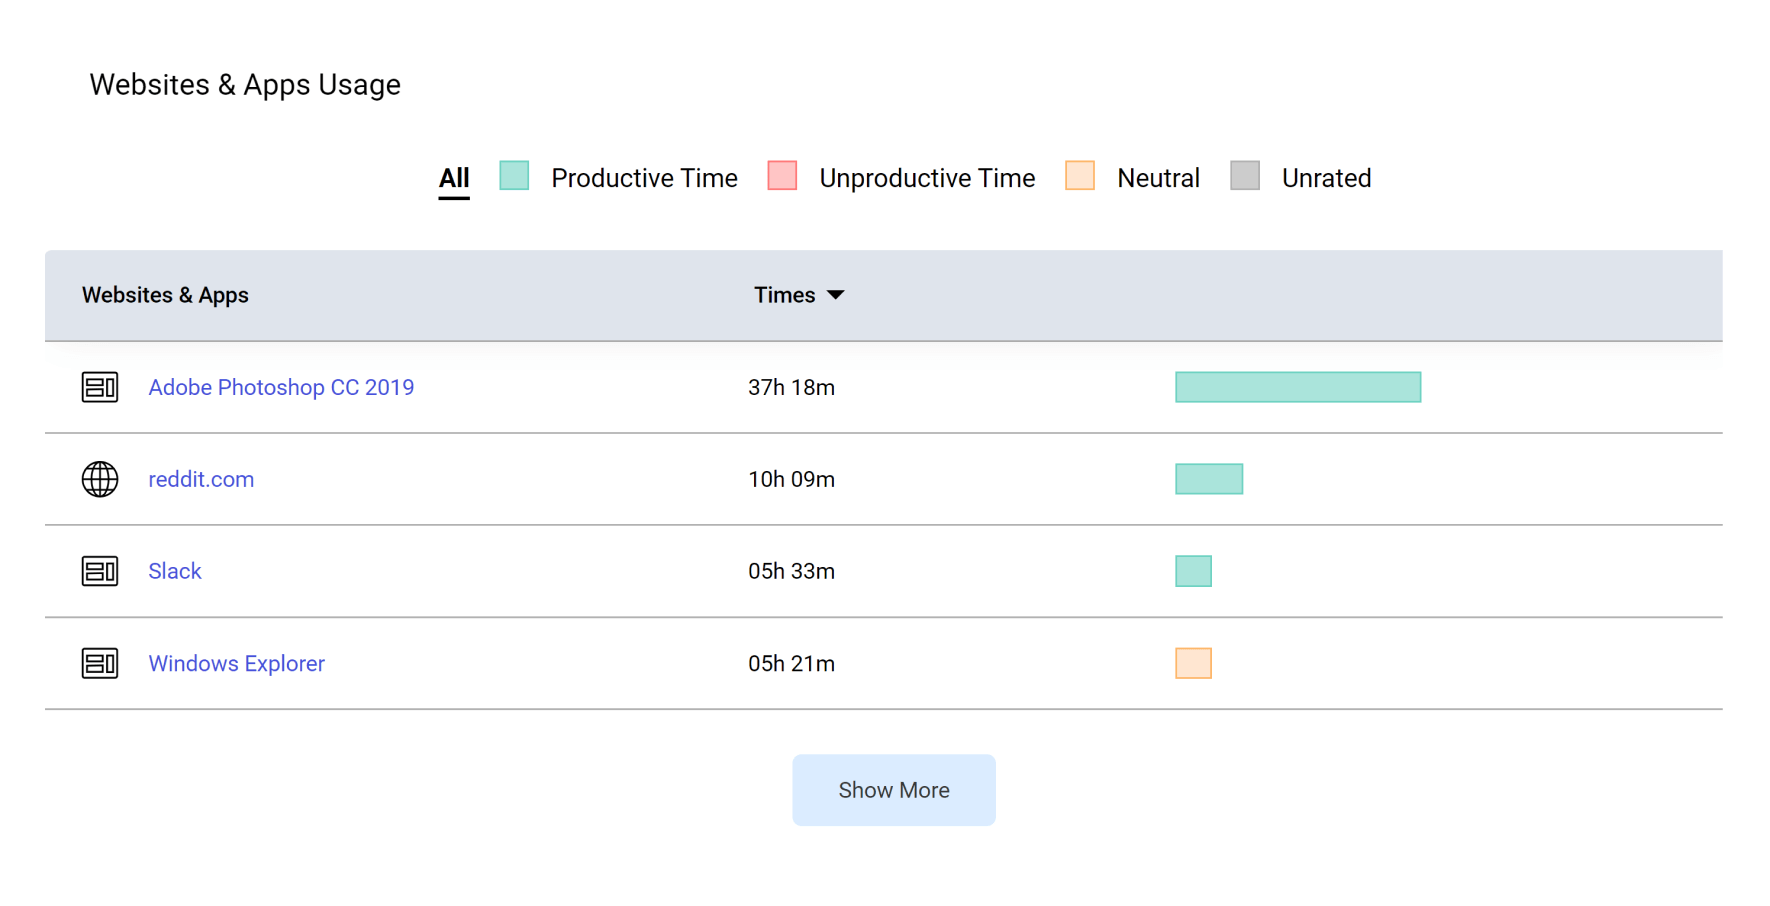
This widget gives you a glance at all the websites and apps a user has used during work hours. It also shows:
Click one of the headings at the top of the section. So when you click “Productive,” you’ll see a list of all productive sites you have used.
Web and app ratings are company-oriented. All the apps are rated as Productive, Unproductive, Neutral, and Unrated by default according to the global ratings.
This will give you a better idea of how productive you have been at work.
Only the admin or the owner can change these ratings to suit the company’s policies from the “Web and Apps Rating” tab. To change Web and App ratings, click here.
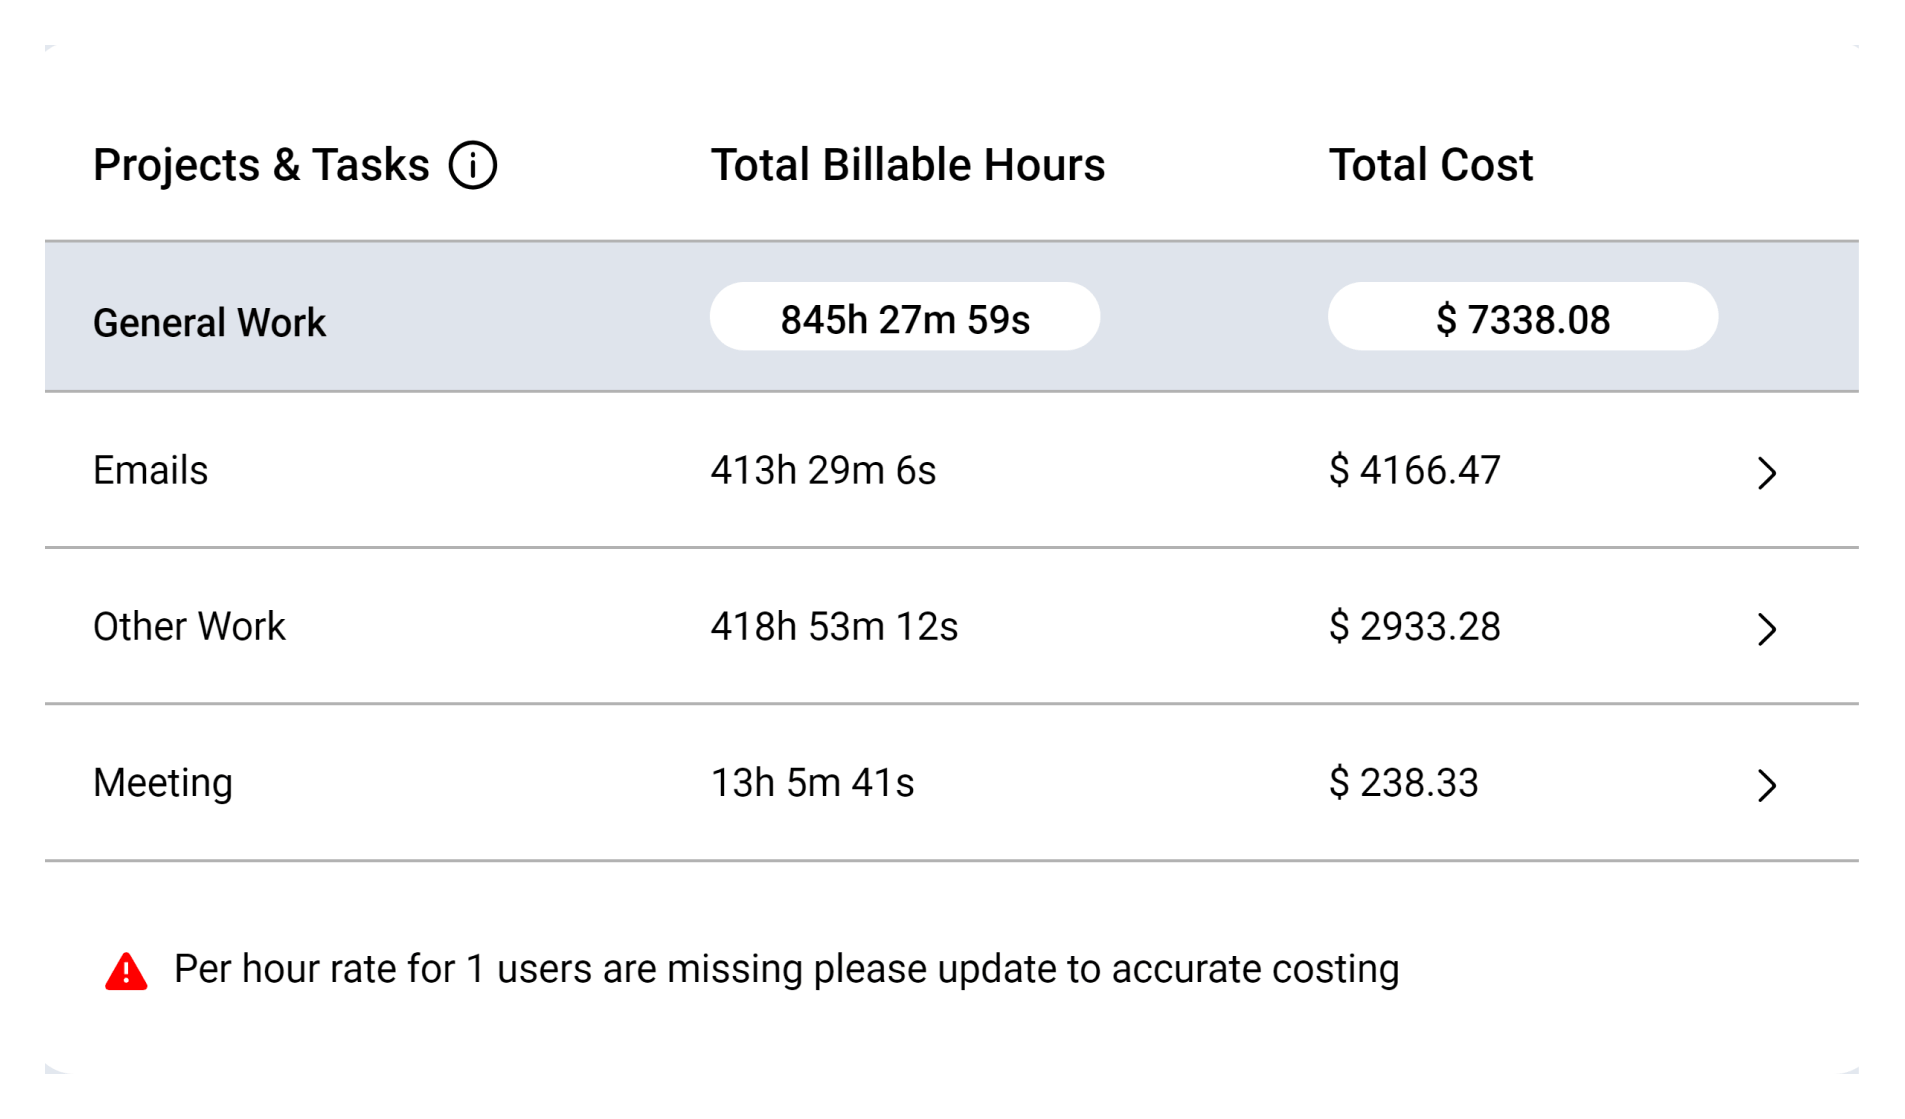
This widget provides a list of projects and tasks the user has worked on, along with the recorded hours.

These projects and tasks can be found on the main dashboard in Settings > Projects and Tasks.
If you want to add, edit, or archive any project, click here.
If you want to view a single user, multiple users, or group reports, use the “Users” filter. For date-specific reports, select your desired date or dates to view specific reports.
Try it free for 14 days and see how it can be your savior!
